FREE trial
FREE trial
FREE trialYou may already have a good
understanding from the application perspective which database query is running
slowly and even the damaging impact on your organisation but when you need more
help to solve the problem DBmarlin is now available to help.
Better performance insights help you ensure your databases run fast, allowing the applications and websites that depend on them to deliver a better experience for your users and customers.
With the DBmarlin Chrome Extension a button is added next to the SQL statement in DataDog so you can link to DBmarlin and see the database performance for that statement with a single click.
Click through from DataDog to DBmarlin to see the Database performance and get AI tuning recommendations.
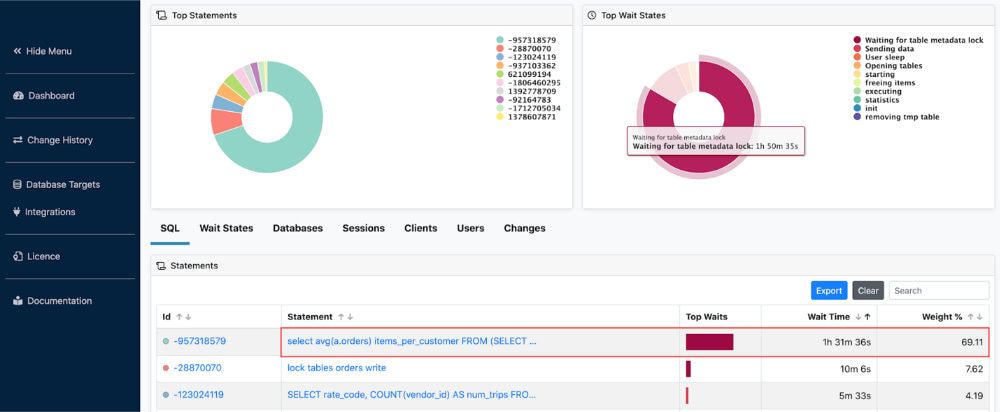
GET THE CHROME EXTENSIONExample showing a MySQL locking problem. DBmarlin shows the SQL being locked and the SQL doing the locking which is the root cause of the performance problem affecting end users.
DBmarlin can identify the root cause of performance problems within your database within a few clicks.
DBmarlin monitors database performance, tracks changes and helps your databases run fast.

Provides an easy to use and consistent way to monitor many different database platforms both self-hosted and in the cloud.

Captures SQL statement text and wait states so you can see exactly where the time is spent when executing SQL within your databases.

Auto-detects changes to schema objects, database parameters and explain plans so you can see their impact on performance.

Allows you to register events such as code releases, or other important events, helping you diagnose the impact of changes against your databases.

Single click from a trace in DataDog to see the performance of a SQL statement in DBmarlin.

Creates a modern and consistent user interface across different database technologies that are easy to understand for experts and non-experts.
Cross-platform database performance tuning and optimisation
Supports self-hosted databases as well as cloud-hosted including DBaaS
Also supports other cloud providers and DBaaS offerings.
DBmarlin can be up and running in minutes, collecting vital information about exactly how your databases are working to support your users. It’s simple to spot performance bottlenecks, relate problems to any changes made and focus on the right corrective actions.
Search DBmarlin