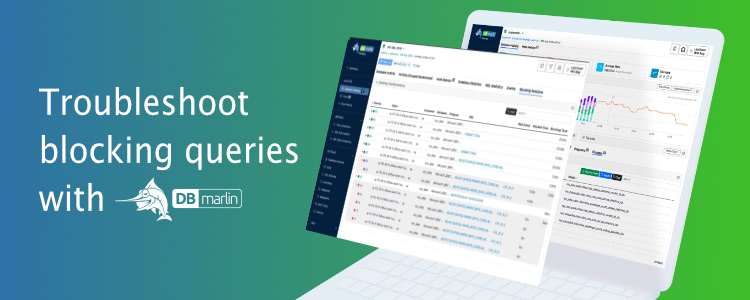
Troubleshoot blocking queries with DBmarlin

Blocked queries are a significant challenge for database analysts, engineers, and anyone tasked with managing database performance at scale. Inefficient query or database design and resource saturation can trigger blocking, which in turn can result in increased latency, errors, and user dissatisfaction.
Identifying root blockers—the underlying problematic queries that cause cascading locks on database resources—is crucial to troubleshooting and addressing database performance issues. However, this can be challenging, particularly when conducting historical analysis after the event may have already disappeared.

Identifying blocked sessions and the queries and sessions being locked
DBmarlin provides detailed visibility into root blocking queries, allowing you to efficiently survey and troubleshoot blocked connections and suboptimal performance across your entire database estate.
With DBmarlin it is easy to quickly assess the number of blocked connections for each of your databases, and see detailed insights that help you identify root blockers:
- See the percentage of time that all sessions spent waiting on locks of various types.
- See the wait event to understand what type of lock is being held.
- Link to our knowledge-base of over 1,100 wait events for a detailed description, 3rd-party links and crucially how you can reduce them.
- Zero in on the precise query statements causing blocking.
- Identify which queries have waited as a result of those blockers.
- Determine how long a specific blocker has spent blocking within a specific time range.
Insights like these can be crucial in improving overall database performance. For example, if you notice regular locking on a particular database, the Blocking Sessions screen can help easily understand blocking activity and accelerate the troubleshooting process so that you can quickly identify the root cause of the problem and fix the problem.

Troubleshooting blocking sessions
The deep visibility which DBmarlin provides into blocked sessions and queries can be instrumental for identifying and troubleshooting incidents that are affecting database performance.
For example, DBmarlin could alert you to a spike in the lock wait time on one of your databases, that may indicate an ongoing incident.

Drilling down with DBmarlin’s Database Activity screen you can see how much time is spent in the blocked state and which sessions, programs, users, SQL Statements are suffering from being blocked.
Clicking to the Blocked Session screen you can then see a list of all blocking trees within the problem time period and quickly identify the blocking Session ID of the head blocker(s).
Unlike most other monitoring tools, DBmarlin checks for blocked sessions every second, which means that it not only collects information about long held locks, but also those that are much shorter in duration but maybe occur many times.

Analyse ongoing incidents or diagnose after the event
The data in DBmarlin is real-time up to the second as well as being stored historically for retrospective analysis so it can help fix both ongoing database blocking problems as well as incidents in the past. For example, on the Blocking Sessions screen:
- You could choose the last 1 minute of activity you can see if the locking problem is still ongoing, in which case you might choose to kill the blocking Session ID to release the lock.
- Or you could choose to look at a period of 9am-10am yesterday when there was a spike in lock wait time, but the locking has already disappeared. However, with DBmarlin you can still use the locking trees during that period to identify the root cause, even after the event.
Summary
If you have a build up of locks in your database where many transactions are waiting on others to complete first, you need to quickly identify the exact cause before it impacts on application and ultimately the business. DBmarlin can help you diagnose and quickly mitigate performance issues by providing all the insights you need to be able to resolve database locking issues. At the time of writing DBmarlin supports capture and display of blocking sessions for Oracle, SQL Server, MySQL and PostgreSQL with others coming soon.

